Charter School Political Polarization
I am currently working on an analysis of charter schools, specifically determining whether the political affiliations of school board members influence the range of courses and activities offered by the school.
TLDR
Schools with more republican board members tend to use words that affilate with American, Tradition. In contrast with schools with more democrat board members tend to use words that affilate with Diversity, Multicultural.
I pulled data from the voter registration database, and the school board members from the school websites. I used OpenAI’s DaVinci model to extract the names of the board members to find their political affiliations.
The same process was used to find the mission/vision statements of each school. I used OpenAI’s Ada model to generate sentence embeddings for the mission/vision statements. I then used TSNE to visualize the clusters of the mission/vision statements. Later Ranking the mission/vision statements by their similarity score to each class of keywords.
Things I couldve done better
Maybe embeds is overkill, cTFIDF wouldve been fine: In my previous experience of analysis there was alot of fluff within the data. So embeds can capture statements similar to those phrases such as globalism == multicultural.
Data
The data has been collected from the EDDIE database, which is part of the North Carolina Education System. It pertains to currently operating charter schools. Information about school board members can be found through the Google search API, which extracts details from school websites. Their political affiliations can be identified from the NC state voter database, provided by the election board.
We’re using OpenAI’s DaVinci model to bypass the need for a base NER Bert model. This is because several NER models exhibit bias against ethnic names like “Yolanda”, incorrectly splitting them as “Yo-”, “land-”, “a”.
The major challenge with using OpenAI is the associated cost and the token limit. It’s important to remember to chunk the texts!
def find_names_openai(text_content:str):

  response = openai.Completion.create(
    model="text-davinci-003",
    prompt=f"context: {text_content} \n\n question: Who are the board members with first and last names?, give it to me as a python list If none are available give me an empty list.",
    temperature=0.86,
    max_tokens=256,
    top_p=1,
    frequency_penalty=0,
    presence_penalty=0
  )
  return(response.choices[0].text)
Once we have the names, we can use a lexically similar search to compare the names and calculate the distance between the residences’ zip codes and the school.
from geopy.distance import geodesic

#lexican similarity comparison
def lexical_similarity(name, name_column):
    name_column = name_column.apply(lambda x: Levenshtein.ratio(name, x))
    return name_column
#calculate the distance from the school to residence
def calculate_distance(lat, lon, lat_column, lon_column):
    distance_column = []
    for lat2, lon2 in zip(lat_column, lon_column):
        distance = geodesic((lat, lon), (lat2, lon2)).miles
        distance_column.append(distance)
    return pd.Series(distance_column)
A similar process can be used to find the elected district board members and their political affiliations. It’s slightly easier to determine political affiliations because elected members are typically residents of the counties they represent.
Analysis
Upon acquiring the political affiliations for each charter and district, you can create three columns representing democrats, republicans, and independents.
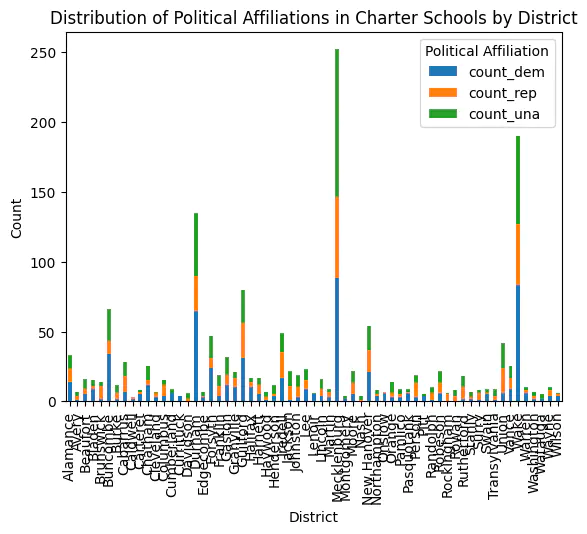
- Note the scale, indicating more charter schools in urban areas - specifically, Wake, Mecklenburg, and Durham.
- Some of the collected data includes parent-board members from charter schools. This could potentially inflate the number of board member positions.
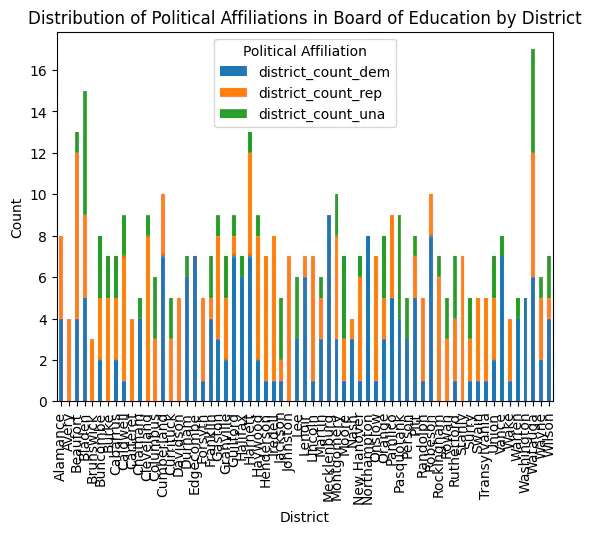
- The distribution of elected board members appears more evenly distributed.
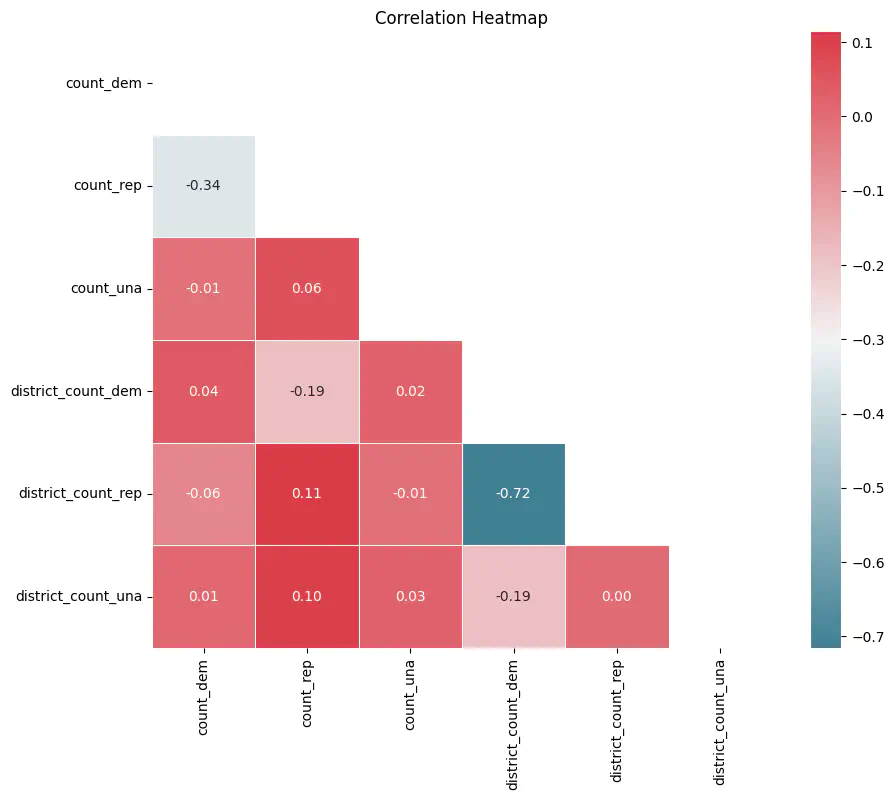
Overlaying a random heatmap for correlation..
District = elected board members, just count = charter school board members
A correlation of -0.72 for district boards of education with republican/democrat board members suggests a high degree of polarization. If there is a high number of either republicans or democrats, the other group tends to have fewer seats.
A correlation of 0.11 indicates that charter schools with more republican board members somewhat align with districts having more republican district board members.
A correlation of 0.10 may imply closet democrats in republican districts registered as unaffiliated, or potential data inconsistencies.
Sentence Embed with OpenAI Ada
We can use OpenAI’s Ada model to generate sentence embeddings for the mission/ vision statements. This is useful for comparing the similarity between two sentences or clustering sentences together and finding the similiarity between clusters.
def get_embedding(text, model="text-embedding-ada-002"):
   text = text.replace("\n", " ")
   time.sleep(5)
   return openai.Embedding.create(input = [text], model=model)['data'][0]['embedding']
complete_mission['ada_embedding'] = complete_mission.mission_statement.apply(lambda x: get_embedding(x, model='text-embedding-ada-002'))
The problem is … its not fantastic for niche topics like education policy. Its really hard to find a sentence embed model that completely understands your corner of the world. Thats why there are medical/financial trained llm models.
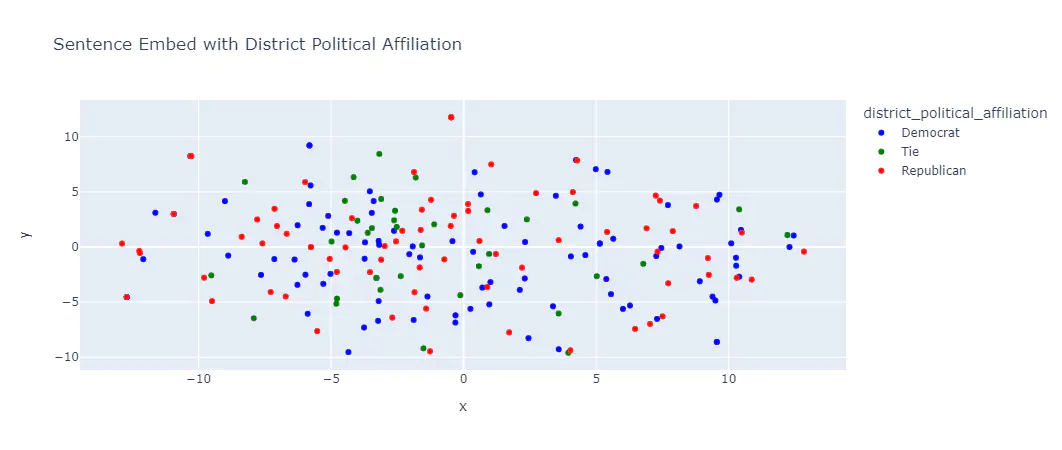
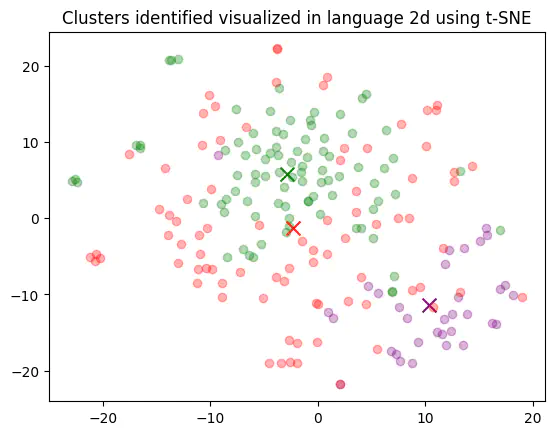
- You can see the initial results of the sentence embed model. The clusters are not very distinct, and the model is not able to distinguish between the two or more groups.
Even force fitting TSNE on top of the sentence embeds doesn’t help much.
At this point we are all out of ideas, our next step is to add a similarity score to the mission vision statements and see if we can find a correlation between the similarity score and the political affiliation of the board members.
Similarity Score
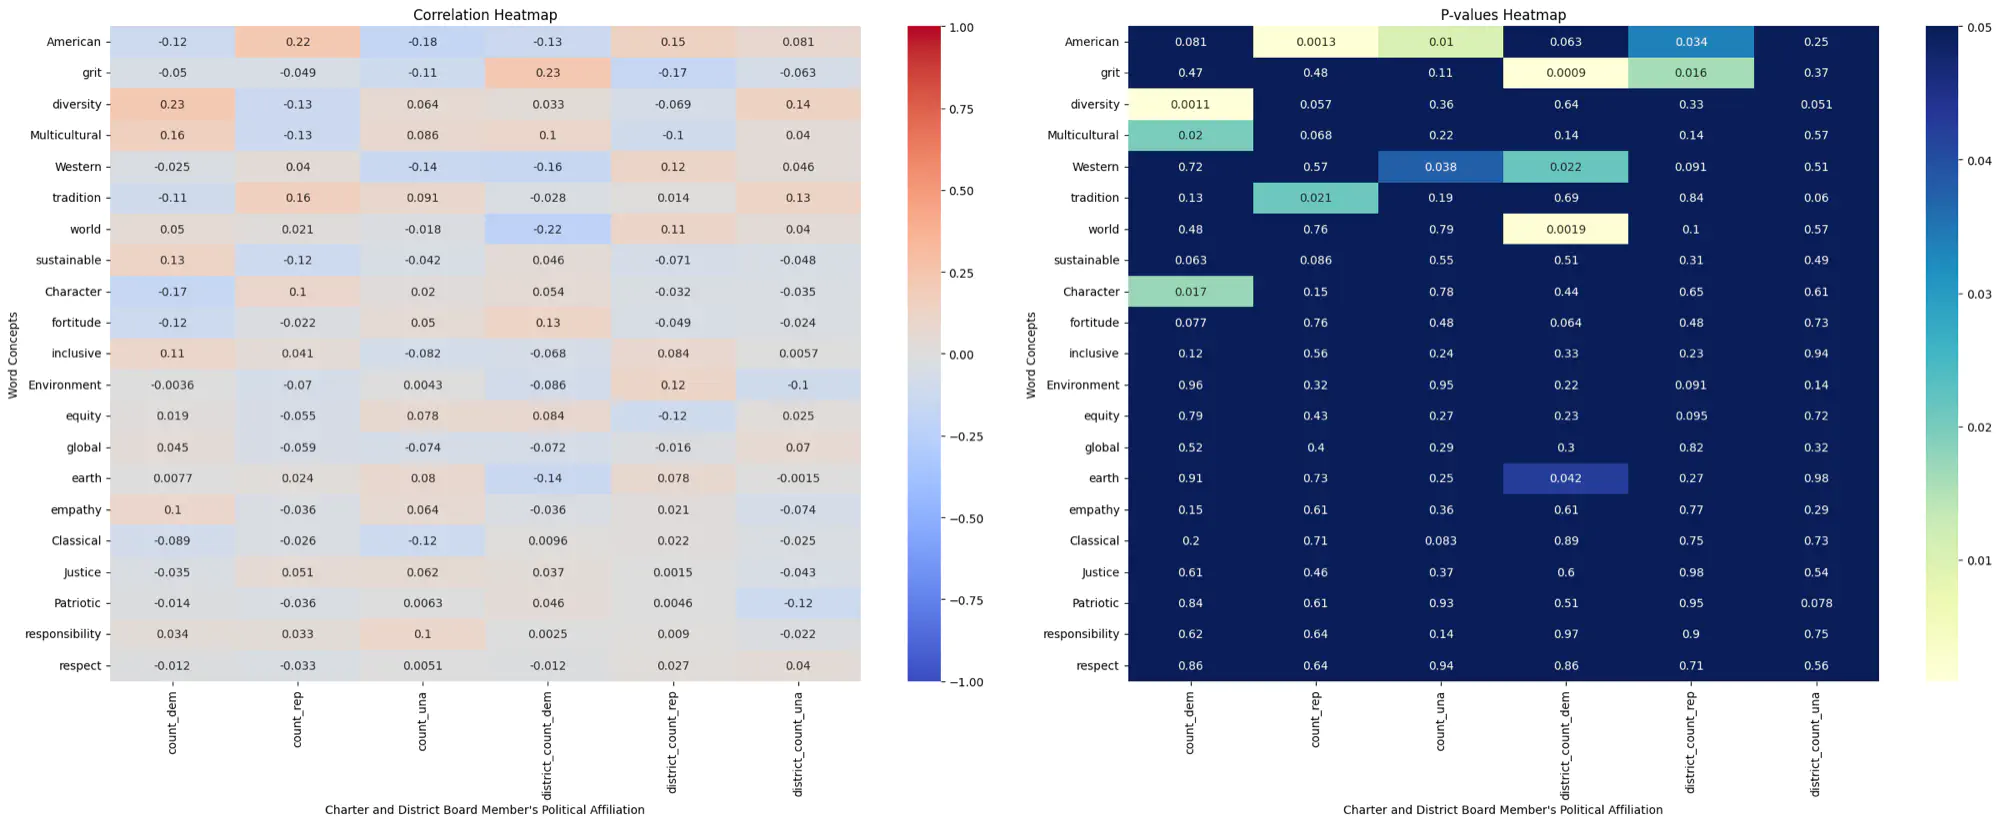
We created a list of classes of keywords that we believe are associated with either republican or democrat board members. We then ranked the mission/vision statements by their similarity score .
  to_sort = ['Justice', 'empathy', 'equity', 'Multicultural', 'diversity',
           'inclusive', 'global', 'world', 'Environment', 'earth',
           'sustainable', 'Classical', 'Western', 'tradition', 'Patriotic',
           'American', 'Character', 'respect', 'responsibility', 'grit', 'fortitude']
With ranking completed, you can do a correlation map with p value attached:
Results
Conservative schools are more likely to use words associated with American and Tradition for their mission statements.
Democratic Schools are more likely to use words associated with Diversity and Multicultural for their mission statements.